Article Title:The Impact of Using Platform Data on Financial Behaviorbr />Article Type:Qaay Blog
Introduction
br />In the dynamic world of crypto assets, informeddecision-makingis the difference between sustainable success and financial failure.br />Many users, even professionals, get caught up in market emotions and make decisions driven more by excitement than analysis.br />However, there is one key distinction between a successful investor and anunsuccessfulone. It is the ability to understand and evaluate personal financial behavior using real data.
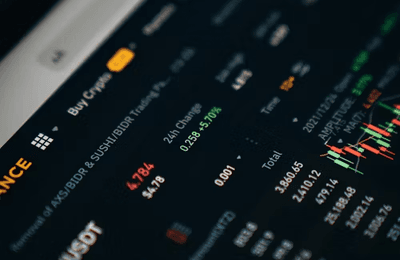
Modern crypto platforms are not merely trading tools. They provide a complete set of dashboards, indicators, and precise analytics that help you identify your financial patterns, correct errors, and make decisions grounded in reality and logic. What matters is knowing how to use a financial platform’s data to analyze financial behavior. This applies to portfolio management, debt control, credit scoring, and user tier status.
Understanding Financial Behavior Through the Portfolio Dashboard
The first step in analyzing financial behavior is looking at the overall picture of your assets. The portfolio dashboard is your main control center. In this section, you can see which assets you hold, how their value has changed over time, and how your investment portfolio is structured.
If you review this data daily or weekly, you will gradually notice patterns. Have your assets mostly increased or decreased? When the market drops, do you feel the urge to sell, or do you stay patient? Is your portfolio overly concentrated in a single crypto asset?
These insights help you understand how you respond to market volatility. If you realize that you sell too quickly during downturns, it may be necessary to keep a portion of your holdings in more stable investments, and that can make your decisions more rational.
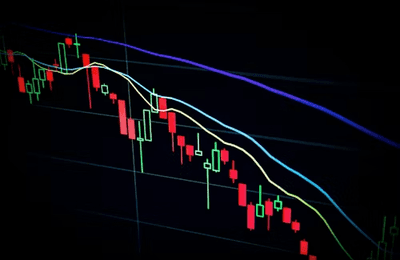
The portfolio dashboard is not only a place to display numbers. It reflects how you think about money and how you act under pressure. Every chart line and every percentage change tells a story about your decisions.
Analyzing the Credit Line Wallet and Debt Status
In the next step, move to the Credit Line Wallet and the Outstanding Loan report. This section provides a clear view of your financial obligations, and it shows how effectively you have used your credit capacity to support capital growth. The data indicates how much you have borrowed, how much has been repaid, and where your loan to collateral ratio currently stands.
For example, if your loan to collateral ratio is below 40%, it typically indicates financial health and an adequate safety buffer. However, if it approaches or exceeds 60%, it is time to reduce risk. You can either repay part of the loan or add more collateral. This simple decision can help prevent forced liquidation during periods of market volatility.
One point that should not be overlooked is the dynamic nature of collateral. Collateral value is updated in real-time based on market prices. This feature helps users see the real impact of market movements as they happen, and respond more thoughtfully. In other words, dynamic collateral shifts financial behavior away from emotion and toward analysis and logic. When someone sees their loan to collateral ratio changing, they can make a deliberate decision about when to restore balance, instead of reacting impulsively.
In practice, this type of real-time monitoring not only helps prevent crises but also encourages financial discipline, planning, and more responsible behavior.
Using Smart Analytical Tools
br />Many financial platforms today offer tools such as a Credit Box and a financial behavior analytics dashboard. These tools present key data, including your active loan balance, borrowing capacity, loan to collateral ratio, and even your credit score, all on a single screen.
The value of such a tool is clarity. You can understand your financial position at a glance and identify risk trends early.
If your credit health indicator shifts from green to orange, it signals rising risk. Signals like this give you time to act before a crisis occurs. Remember, prevention is always less costly than recovery.
A user who spends a few minutes each day reviewing their Credit Box is less likely to face critical situations and is more capable of making smart financial decisions.
Analyzing Financial Behavior Over Time
Your financial behavior is not a single snapshot. It is a long-running story, and to understand it accurately, you need to examine trends. Many platforms provide monthly or quarterly reports that include changes in your portfolio, profit and loss, transactions, and credit ratios. By reviewing these reports, you can identify your behavioral patterns.
For instance, you may realize that during market rallies you buy too aggressively, or that during downturns you exit too early. Recognizing these patterns helps you make more rational decisions in the future.
In simple terms, analyzing past data means seeing the most accurate version of yourself as an investor. If you do not see this picture, your financial growth will be driven by chance rather than awareness.
The Role of User Tier in Analyzing Financial Behavior
Your user tier on a platform is not just a label. It reflects your level of activity and your financial commitment. Users at higher tiers typically benefit from lower fees, better interest rates, and broader credit features.
Analyzing tier-related data helps you understand whether you are using your current capacity effectively, or whether a small improvement could move you to a higher level.
If you know that upgrading to the next tier reduces loan interest rates, it may be worth increasing your assets to reach that level. However, it is important to make this decision consciously, and based on data, not simply for appearance or ranking.
Think of your tier as an indicator of your financial credibility. It is a tool that shows whether you are on a structured path toward financial growth.
From Reaction to Awareness: The Power of Data-Driven Decision Making
Analyzing platform data is not only about understanding numbers. It is about understanding yourself. Every figure reflects a decision you have made, and every decision has shaped part of your financial habits. When a user reads the data, learns from it, and acts on it, this analysis helps them move from being an average investor to becoming an informed, strategic investor.
So, do not view your platform data as cold, lifeless numbers. It is the language of your capital. Listen to it, learn from it, and let it guide your financial path.
Conclusion
In the highly volatile crypto market, controlling emotions is difficult, but data analysis is a guiding light in the uncertainty of decision-making. Every time you review your portfolio dashboard and monitor your loan-to-collateral ratio, you are taking a step toward financial maturity and economic independence.
Remember, financial stability is the result of small but deliberate decisions. Modern crypto platforms already provide you with all the necessary data. The only thing you need to do is monitor it, learn from it, and make decisions based on it.
A smart investor is not someone who always makes a profit. It is someone who understands why they profited or why they lost. This level of understanding is achieved only through real data analysis and dynamic monitoring of assets and collateral.